Without any modifications, React is really fast as-is. There are, however, a few things that you can do to improve performance. While working at HelloSign, I discovered some quick fixes that made our apps incredibly snappy. With these simple changes, I was able to reduce render time from over 3000 milliseconds to less than 200 milliseconds.
Editor’s Note:
Check out our upcoming React University Workshops. Our next workshop, React 2016, will be held on April 23 at Microsoft Reactor in San Francisco and will offer a deep dive into creating modern Single-Page Applications (SPA) using React, Redux, React Router, Immutable.js, and Webpack. Also, if you’re interested in learning the basics about what it takes to be a Data Visualization Engineer, check out React and D3.
Introduction
HelloSign is a cloud-based electronic signature tool founded in 2010. As you can imagine, HelloSign is a very JavaScript-heavy codebase. A lot of client-side behavior is necessary to create a rich signing experience. Lately, we’ve moved much of our codebase toward React. In fact, in many places we’ve broken up our codebase into several single-page applications written in React.
Although the HelloSign team was happy with React’s performance before I initially joined the project, I quickly found some low-hanging fruit that could improve runtime speed. Here are the steps you should take to see similar improvements in your own applications.
Create a Baseline Performance Measurement
Before you begin, you should take a baseline measurement. Optimizations are meaningless if you can’t verify the results of your modifications.
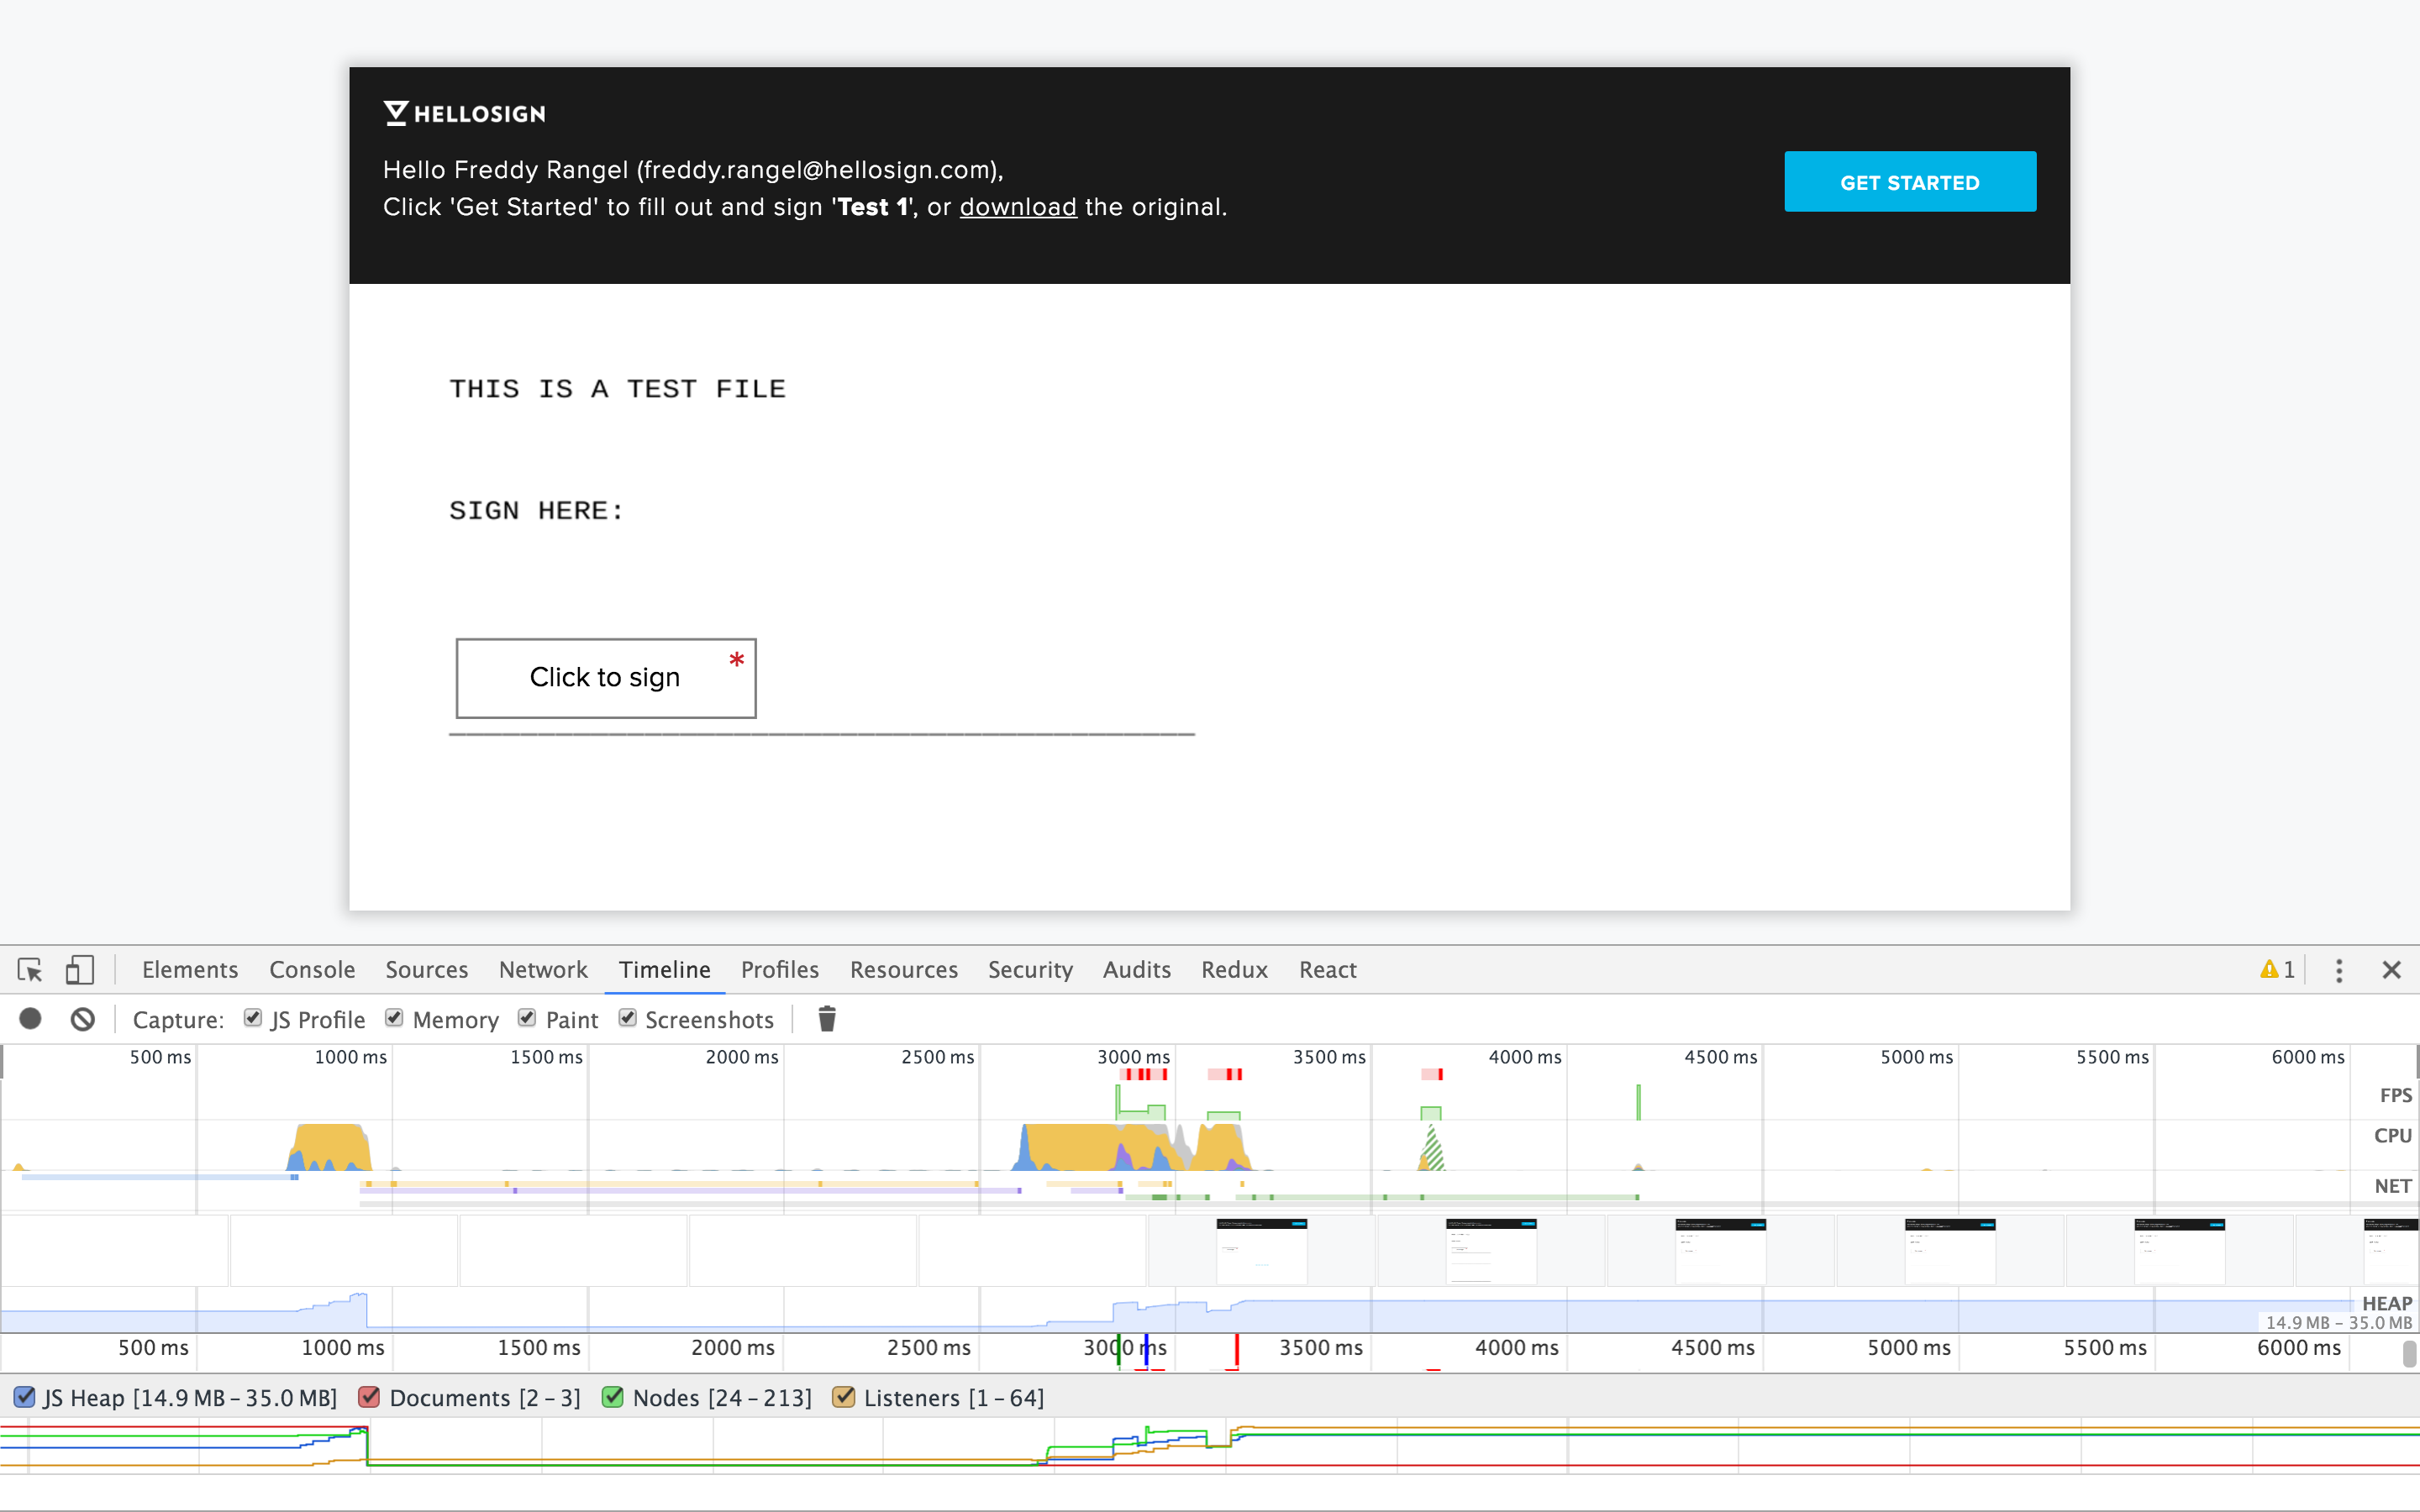
Thankfully, Chrome has excellent developer tools to help. One, little-used feature of Chrome’s DevTools is the “Timeline” tool. It allows you to record and analyze all activity in your application. You can record interactions on the page, locate potential memory leaks, measure the total time it takes to perform a task, and identify areas of potential jank. Best of all, the results can be recorded for comparison with your final benchmark.
There’s actually a really awesome video on Chrome’s DevTools that goes into detail about the “Timeline” feature. You can view it here.
We chose to measure the time elapsed between the initial paint of our signer page to the final rendering of the entire page. The initial download of our bundles still needs some optimization, but we’re neither going to mess with nor measure this parameter. It’s fairly easy and consistent to test render time rather than trying to click areas around the page and trying to measure its performance in a repeatable way. Then, all we needed to do was to go to the signer page, open Chrome’s DevTools “Timeline” tab, and refresh the page.
As a side note, make sure that when performing this test, the “Paint” and “Screenshots” boxes are checked so that you can see what the user sees as the page is being rendered.
After all that, we determined that our rendering time from initial paint was a little over 3 seconds. Much too long. Luckily, there was little we had to do to make this quite a bit faster.
Set NODE_ENV to Production
This step is easy to get wrong, even if you are well-informed. React’s documentation provides an overview, but doesn’t provide many specifics. React has great developer warnings and error checking, but these are only intended for development; if you take a look at React’s source code, you’ll see a lot of if (process.env.NODE_ENV != 'production') checks. This is running extra code that is not needed by the end user, not to mention that calling process.env.NODE_ENV is extremely slow. For production environments, we can remove all this unnecessary code. Just keep in mind that you don’t want to do this in development because it will remove all those helpful developer warnings.
If you’re using Webpack, you can use DefinePlugin to replace all instances of process.env.NODE_ENV with 'production', and then use the UglifyJsPlugin to remove all the dead code that no longer runs. Here’s a sample setup that you might use:
// webpack.config.js
  ...
  plugins: [
    new webpack.DefinePlugin({
      // A common mistake is not stringifying the "production" string.
      'process.env.NODE_ENV': JSON.stringify('production')
    }),
    new webpack.optimize.UglifyJsPlugin({
      compress: {
        warnings: false
      }
    })
  ]
  ...
React Constant and Inline Elements Transforms
React 0.14 introduced support for certain transpile time optimizations with Constant and Inline Element Babel Transforms. React Constant Elements treats JSX elements as values and hoists them to a higher scope. In other words, it hoists static elements and thereby reduces calls to React.createClass. React Inline Elements converts JSX elements into the object literals that they eventually return. Again, this minimizes the runtime calls to React.createClass.
The implementation is rather simple. We added our Babel configuration in our package.json file:
// package.json
  ...
  "babel": {
    "env": {
      "production": {
        "plugins": [
          "transform-react-constant-elements",
          "transform-react-inline-elements"
        ]
      }
    }
  },
  ...
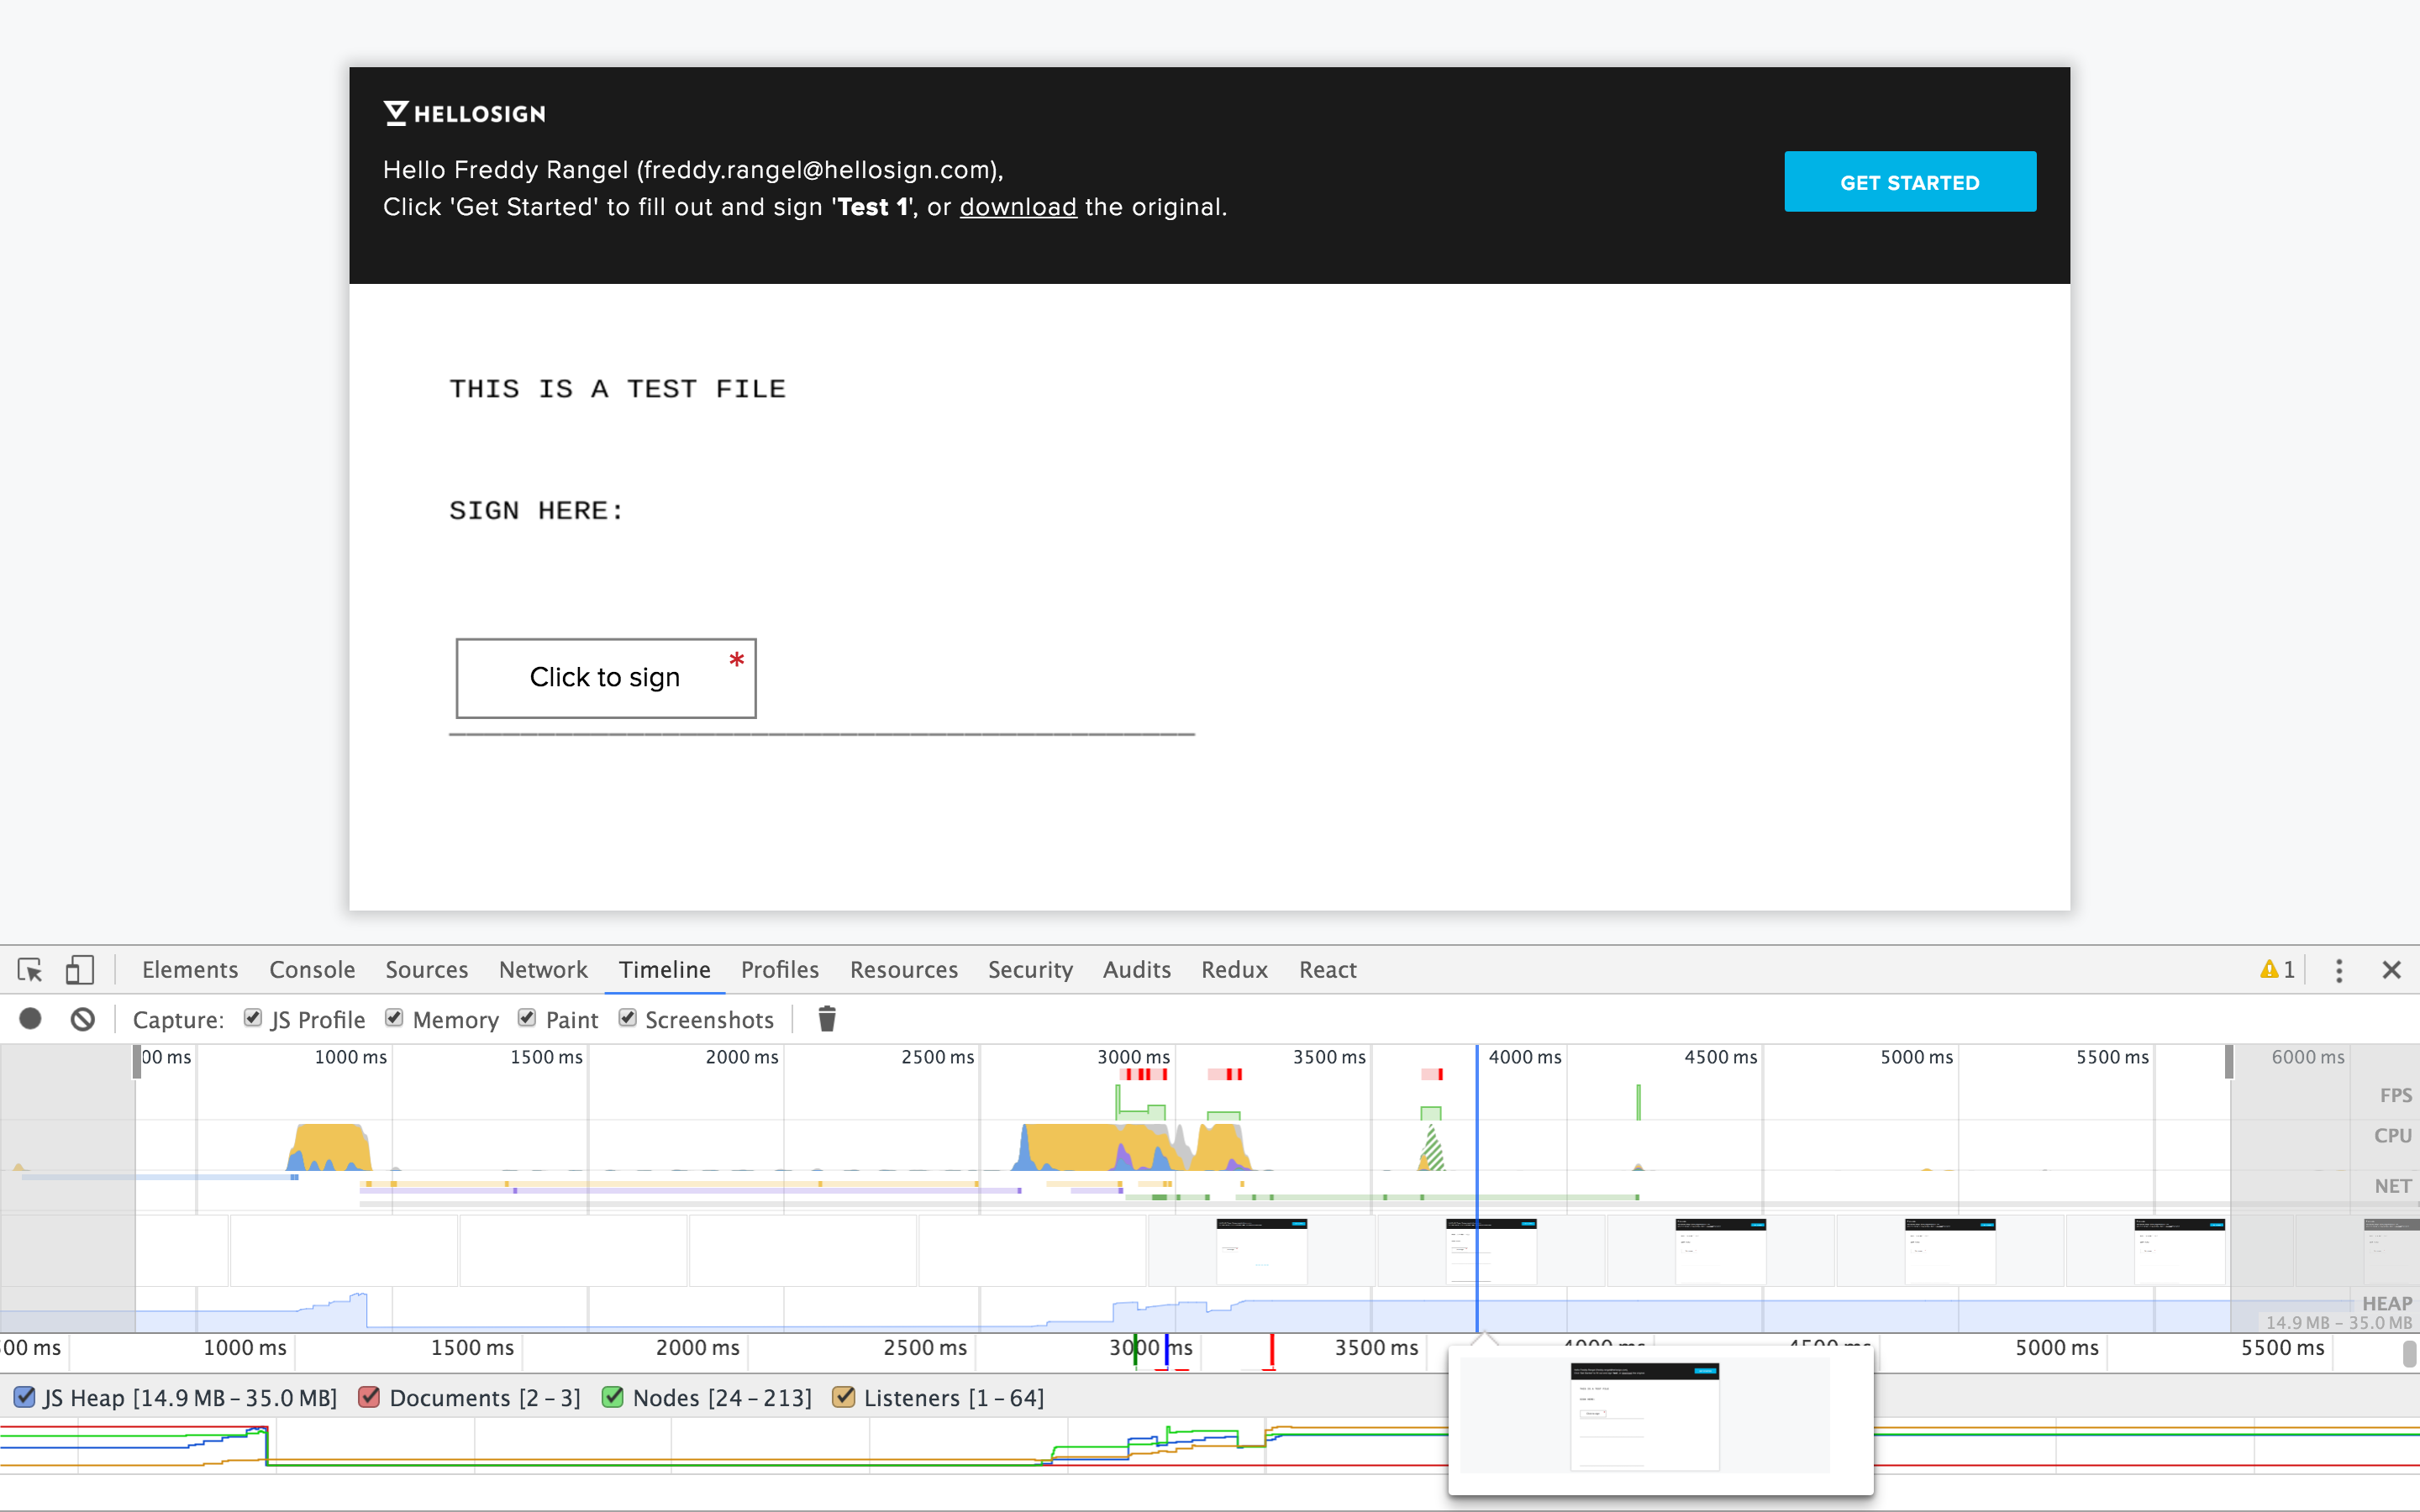
Final Measurement / Conclusion
Lastly, you’ll want to run the benchmark again and compare it with that saved benchmark from before these optimizations. As you can see, the total runtime profile ends 200ms after initial paint! That’s 15 times faster!