
At this point, we can safely say that React is the preferred JavaScript library for building user interfaces. It is used practically everywhere and is almost as pervasive as jQuery. It has an API that is simple, powerful, and easy to learn. Its performance metrics are really impressive thanks to the Virtual DOM and its clever diff algorithm between state changes. Nothing, however, is perfect, and React too has its limitations. One of React’s greatest strengths is the ease with which it integrate third-party libraries, but some libraries, especially opinionated ones, are more difficult to integrate than others.
An extremely popular library that can be tricky to integrate with React is D3.js. D3 is an excellent data visualization library with a rich and powerful API. It is the gold standard of data visualizations. However, Because this library is opinionated about data, it is no trivial endeavour to get it to work with React. A few simple strategies permit these two libraries to work together in very powerful ways.
Editor’s Note: Check out our upcoming workshop, React and D3, a crash course in learning how to create data visualizations with these two in demand libraries. Reserve your spot now on Eventbrite and get 20% off admission. Learn more at the Eventbrite page
What is React?
React is an open-source JavaScript library for creating user interfaces that addresses the challenges of building large applications with data that changes over time. Originally developed at Facebook, it is now seen in many of the most commonly used web applications including Instagram, Netflix, Airbnb, and HelloSign.
Why is React so popular?
React helps developers build applications by helping manage the application state. It’s simple, declarative, and composable. React is not a traditional MVC framework because React is really only interested in building user interfaces. Some have called it the “V(iew)” in MVC, but that’s a little misleading. React’s viewpoint is different. As application logic has reoriented toward the client, developers have applied more structure to their front-end JavaScript. We applied a paradigm that we already understood from the server (MVC) to the browser. Of course, the browser environment is very different from the server. React acknowledges that client-side applications are really a collection of UI components that should react to events like user interaction.
React encourages the building applications out of self-contained, reusable components that only care about a small piece of the UI. Other frameworks such as Angular also attempt to do this, but React stands out because it enforces a unidirectional data flow from parent component to child component. This makes debugging much easier. Debugging is the hardest part of application development, so while React is more verbose that other libraries or frameworks, in the end it saves a lot of time. In a framework like Angular’s, it can be hard to figure out where a bug is coming from: The view? The model? The controller? The directive? The directive controller? Data in Angular flows in many different directions, and this makes it hard to reason about that state of your application. In React, when there is a bug (and there will be!), you can quickly determine where the bug originated from because data only moves in one direction. Locating a bug is as simple as connecting the numbered dots until you find the culprit.
What is D3?
D3 (Data-Driven Documents) is a JavaScript library for producing dynamic, interactive data-visualizations. It’s fairly low level, and the developer has a lot of control over the end result. It takes a bit of work to get D3 to do what you want, so if you’re looking for a more prepackaged solution, you’re probably better off with highcharts.js. That said, it is fairly simple to pick up once you get the hang of it.
D3 does four main things:
- LOADS: D3 has convenient methods for importing data from CSV documents.
- BINDS: D3 binds data elements to the DOM via JavaScript and SVG.
- TRANSFORMS: data can be adjusted to fit your visual requirements
- TRANSITIONS: D3 can respond to user input and animate elements based on that input
Why Would We Want To Use React with D3?
D3 is great at data visualizations, but it manipulates the DOM directly to display that data. Rendering DOM elements is where React shines. It uses a virtual representation of the DOM (virtual DOM) and a super performant diffing algorithm in order to determine the fastest way to update the DOM. We want to leverage React’s highly efficient, declarative, and reusable components with D3’s data utility functions. Also, once we create a chart component, we can want to be able to reuse that chart with different data anywhere in our app.
How to use React and D3?
D3, like React, is declarative.D3 uses data binding, whereas React uses a unidirectional data flow paradigm. Getting these two libraries to work together takes a bit of work, but the strategy is fairly simple: since SVG lives in the DOM, let React handle displaying SVG representations of the data and lett D3 handle all the math to render the data.
Of course, we’ll have to make compromises. React is unopinionated and flexible, thereby allowing you to accomplish whatever needs to be done. Some tasks, like creating axes, are tedious. We can let D3 directly access the DOM and create. It handles axes well, and since we only need to create very few, this tactic won’t affect performance.
Let’s go through a simple example. I created a repository you can use to follow along here: playing-with-react-and-d3. You can follow in the unfinished directory and if you get stuck you can take a look at the finished directory.
Let’s generate a random list of X-Y coordinates and display them on a ScatterPlot chart. If you’re following the tutorial, a finished example is provided for you under the “finished” directory, but you can also follow along under “unfinished.” I’ve gone through the trouble of doing all the setup for you. The build will automatically be created from “unfinished/src/index.jsx”
Let’s start by creating a simple “Hello World!” React component. Create a file under “components” named “chart.jsx”
// unfinished/src/components/chart.jsx
import React from 'react';

export default (props) => {
  return <h1>Hello, World!</h1>;
}
This example is simple, but let’s go over the explanation anyway. Since we’re rendering a simple H1 with no state, we can just export a function that returns the HTML we expect. If you’re familiar with Angular or Ember, it might look weird to insert HTML directly into our JS code. On the one hand, this goes against everything we’ve learned about unobtrusive JavaScript. But on the other hand, it actually makes sense: we’re not putting JavaScript in our HTML, we’re putting our HTML into our JavaScript. React sees HTML and client-side JavaScript as fundamentally bonded together. They’re both concerned about one thing – rendering UI components to the user. They simply cannot be separated without losing the ability to see what your component is going at a glance. The great benefits of this approach is that you can describe exactly what your component will look like when it’s rendered.
Also, keep in mind that this is only possible with JSX, which translates HTML elements into React functions that will render the HTML to the page.
Now, let’s move on and mount our component to the DOM. Open up “index.jsx”
// unfinished/src/index.jsx
import './main.css';
import React    from 'react';
import ReactDOM from 'react-dom';
import Chart    from './components/chart.jsx';

const mountingPoint = document.createElement('div');
mountingPoint.className = 'react-app';
document.body.appendChild(mountingPoint);
ReactDOM.render(<Chart/>, mountingPoint);
You probably noticed a few things. You might be wondering why we’re requiring a CSS file. We’re using Webpack, which allows us to require CSS files. This is very useful when we modularize both our stylesheets and our JavaScript. We’re also creating a div in which we want to mount our React app. This is just a good practice in case you want to do other things on the page then render a React component. Lastly, we’re calling render on ReactDOM with 2 arguments, the name of the component and the DOM element we want to mount it on.
Now, let’s install all the dependencies by navigating to the unfinished directory and running npm i. Then, fire up the server with npm run start and go to localhost:8080
Awesome! We have rendered our first React component! Let’s do something a little less trivial now.
Let’s compose some functions that will create an array of random data points and then render a scatter plot. While we’re at it, we’ll add a button to randomize the dataset and trigger a re-render of our app. Let’s open up our Chart component and add the following:
// unfinished/src/components/chart.jsx
import React       from 'react';
import ScatterPlot from './scatter-plot';

const styles = {
  width   : 500,
  height  : 300,
  padding : 30,
};

// The number of data points for the chart.
const numDataPoints = 50;

// A function that returns a random number from 0 to 1000
const randomNum     = () => Math.floor(Math.random() * 1000);

// A function that creates an array of 50 elements of (x, y) coordinates.
const randomDataSet = () => {
  return Array.apply(null, {length: numDataPoints}).map(() => [randomNum(), randomNum()]);
}

export default class Chart extends React.Component{
  constructor(props) {
    super(props);
    this.state = { data: randomDataSet() };
  }

  randomizeData() {
    this.setState({ data: randomDataSet() });
  }

  render() {
    return <div>
      <h1>Playing With React and D3</h1>
      <ScatterPlot {...this.state} {...styles} />
      <div className="controls">
        <button className="btn randomize" onClick={() => this.randomizeData()}>
          Randomize Data
        </button>
      </div>
    </div>
  }
}
Since we want our component to manage it’s own state, we need to add a bit more code than was necessary for our previous “Hello World” stateless functional component. Instead of just a function, we’re going to extend React.Component and describe our component in the render() method. render() is the heart of any React component. It describes what our component is supposed to looks like. React will call render() on initial mount and on every state change.
Inside of render(), we are both rendering a scatter plot component as if it were an HTML element and setting some properties or “props”. The ... syntax is a convenient JSX and ES2015 spread operator that spreads the attributes of an array or object instead of doing all of that explicitly. For more information check out: JSX Spread Attributes. We’re going to use render() to pass our data and a style object that will be used by some of our child components.
In addition, we’re also rendering a button with an onClick event handler. We’re going to wrap this.randomizeData() with an arrow function and bind the value of this to our Chart component. When the button is clicked, randomizeData() will call this.setState() and pass in some new data.
Let’s talk about this.setState(). If render() is the heart of a React component, setState() is the brains of a component. setState explicitly tells React that we’re changing the state, thereby triggering a re-render of the component and its children. This essentially turns UI components into state machines.
Inside of setState(), we’re passing an object with data set to the randomDataSet(). This means that if we want to retrieve the state of our application, we need only call this.state.whateverStateWereLookingFor. In this case, we can retrieve the randomData by calling this.state.data.
A little side note on how React works: React offers great performance for rendering UI components by implementing a diff algorithm and comparing a virtual DOM in memory with the actual DOM. When you think about it, the DOM is really a large tree structure. If there’s one thing we have learned from decades of computer science research, it’s how to compare and manipulate trees. React takes advantage of clever tree diffing algorithms, but in order to work, each component can only render one parent element (i.e., you cannot render sibling elements). That’s why In the render function we’re wrapping all our elements in one parent div.
Let’s get started with the scatter plot component. Create a file unfinished/src/components/scatter-plot.jsx :
// unfinished/src/components/scatter-plot.jsx
import React        from 'react';
import d3           from 'd3';
import DataCircles  from './data-circles';

// Returns the largest X coordinate from the data set
const xMax   = (data)  => d3.max(data, (d) => d[0]);

// Returns the highest Y coordinate from the data set
const yMax   = (data)  => d3.max(data, (d) => d[1]);

// Returns a function that "scales" X coordinates from the data to fit the chart
const xScale = (props) => {
  return d3.scale.linear()
    .domain([0, xMax(props.data)])
    .range([props.padding, props.width - props.padding * 2]);
};

// Returns a function that "scales" Y coordinates from the data to fit the chart
const yScale = (props) => {
  return d3.scale.linear()
    .domain([0, yMax(props.data)])
    .range([props.height - props.padding, props.padding]);
};

export default (props) => {
  const scales = { xScale: xScale(props), yScale: yScale(props) };
  return <svg width={props.width} height={props.height}>
    <DataCircles {...props} {...scales} />
  </svg>
}
There’s a lot going on here, so let’s start with the stateless functional component that we’re exporting. D3 uses SVG to render data visualizations. D3 has special methods for creating SVG elements and binding data to those elements – but we’re going to let React handle that. We’re creating an SVG element with the properties passed in by the Chart component and which can be accessed via this.props. Then we’re creating a DataCircles component (more on that below) which will render the points for the scatter plot.
Let’s talk about D3 scales. This is where D3 shines. Scales takes care of the messy math involved in converting your data into a format that can be displayed on a chart. If you have a data point value 189281, but your chart is only 200 pixels wide, then D3 scales converts that value to a number you can use.
d3.scale.linear() returns a linear scale. D3 also supports other types of scales (ordinal, logarithmic, square root, etc.), but we won’t be talking about those here. domain is short for an “input domain”, i.e., the range of possible input values. It takes an array of the smallest input value possible and the maximum input value. range on its own is the range of possible output values. So in domain, we’re setting the range of possible data values from our random data, and in range we’re telling D3 the range of our chart. d3.max is a D3 method for determining the maximum value of a dataset. It can take a function which D3 will use to give the max values of the X and Y coordinates.
We use the scales to render the data circles and our axes.
Let’s create the DataCircles component under unfinished/src/components/data-circles.jsx
// unfinished/src/components/data-circles.jsx
import React from 'react';

const renderCircles = (props) => {
  return (coords, index) => {
    const circleProps = {
      cx: props.xScale(coords[0]),
      cy: props.yScale(coords[1]),
      r: 2,
      key: index
    };
    return <circle {...circleProps} />;
  };
};

export default (props) => {
  return <g>{ props.data.map(renderCircles(props)) }</g>
}
In this component, we’re rendering a g element, the SVG equivalent to a div. Since we want to render a point for every set of X-Y coordinates, were must render multiple sibling elements which we wrap together in a g element for React to work. Inside of g, we’re mapping over the data and rendering a circle for each one using renderCircles. renderCircles creates an SVG circle element with a number of properties. Here’s where we’re setting the x and y coordinates (cx and cy respectively) with the D3 scales passed in from the scatter plot component. r is the radius of our circle, and key is something React requires us to do. Since we’re rendering identical sibling components, React’s diffing algorithm needs a way to keep track of them as it updates the DOM over and over. You can use any key you like, as long as it’s unique to the list. Here we’re just going to use the index of each element.
Now, when we look at our browser, we see this:
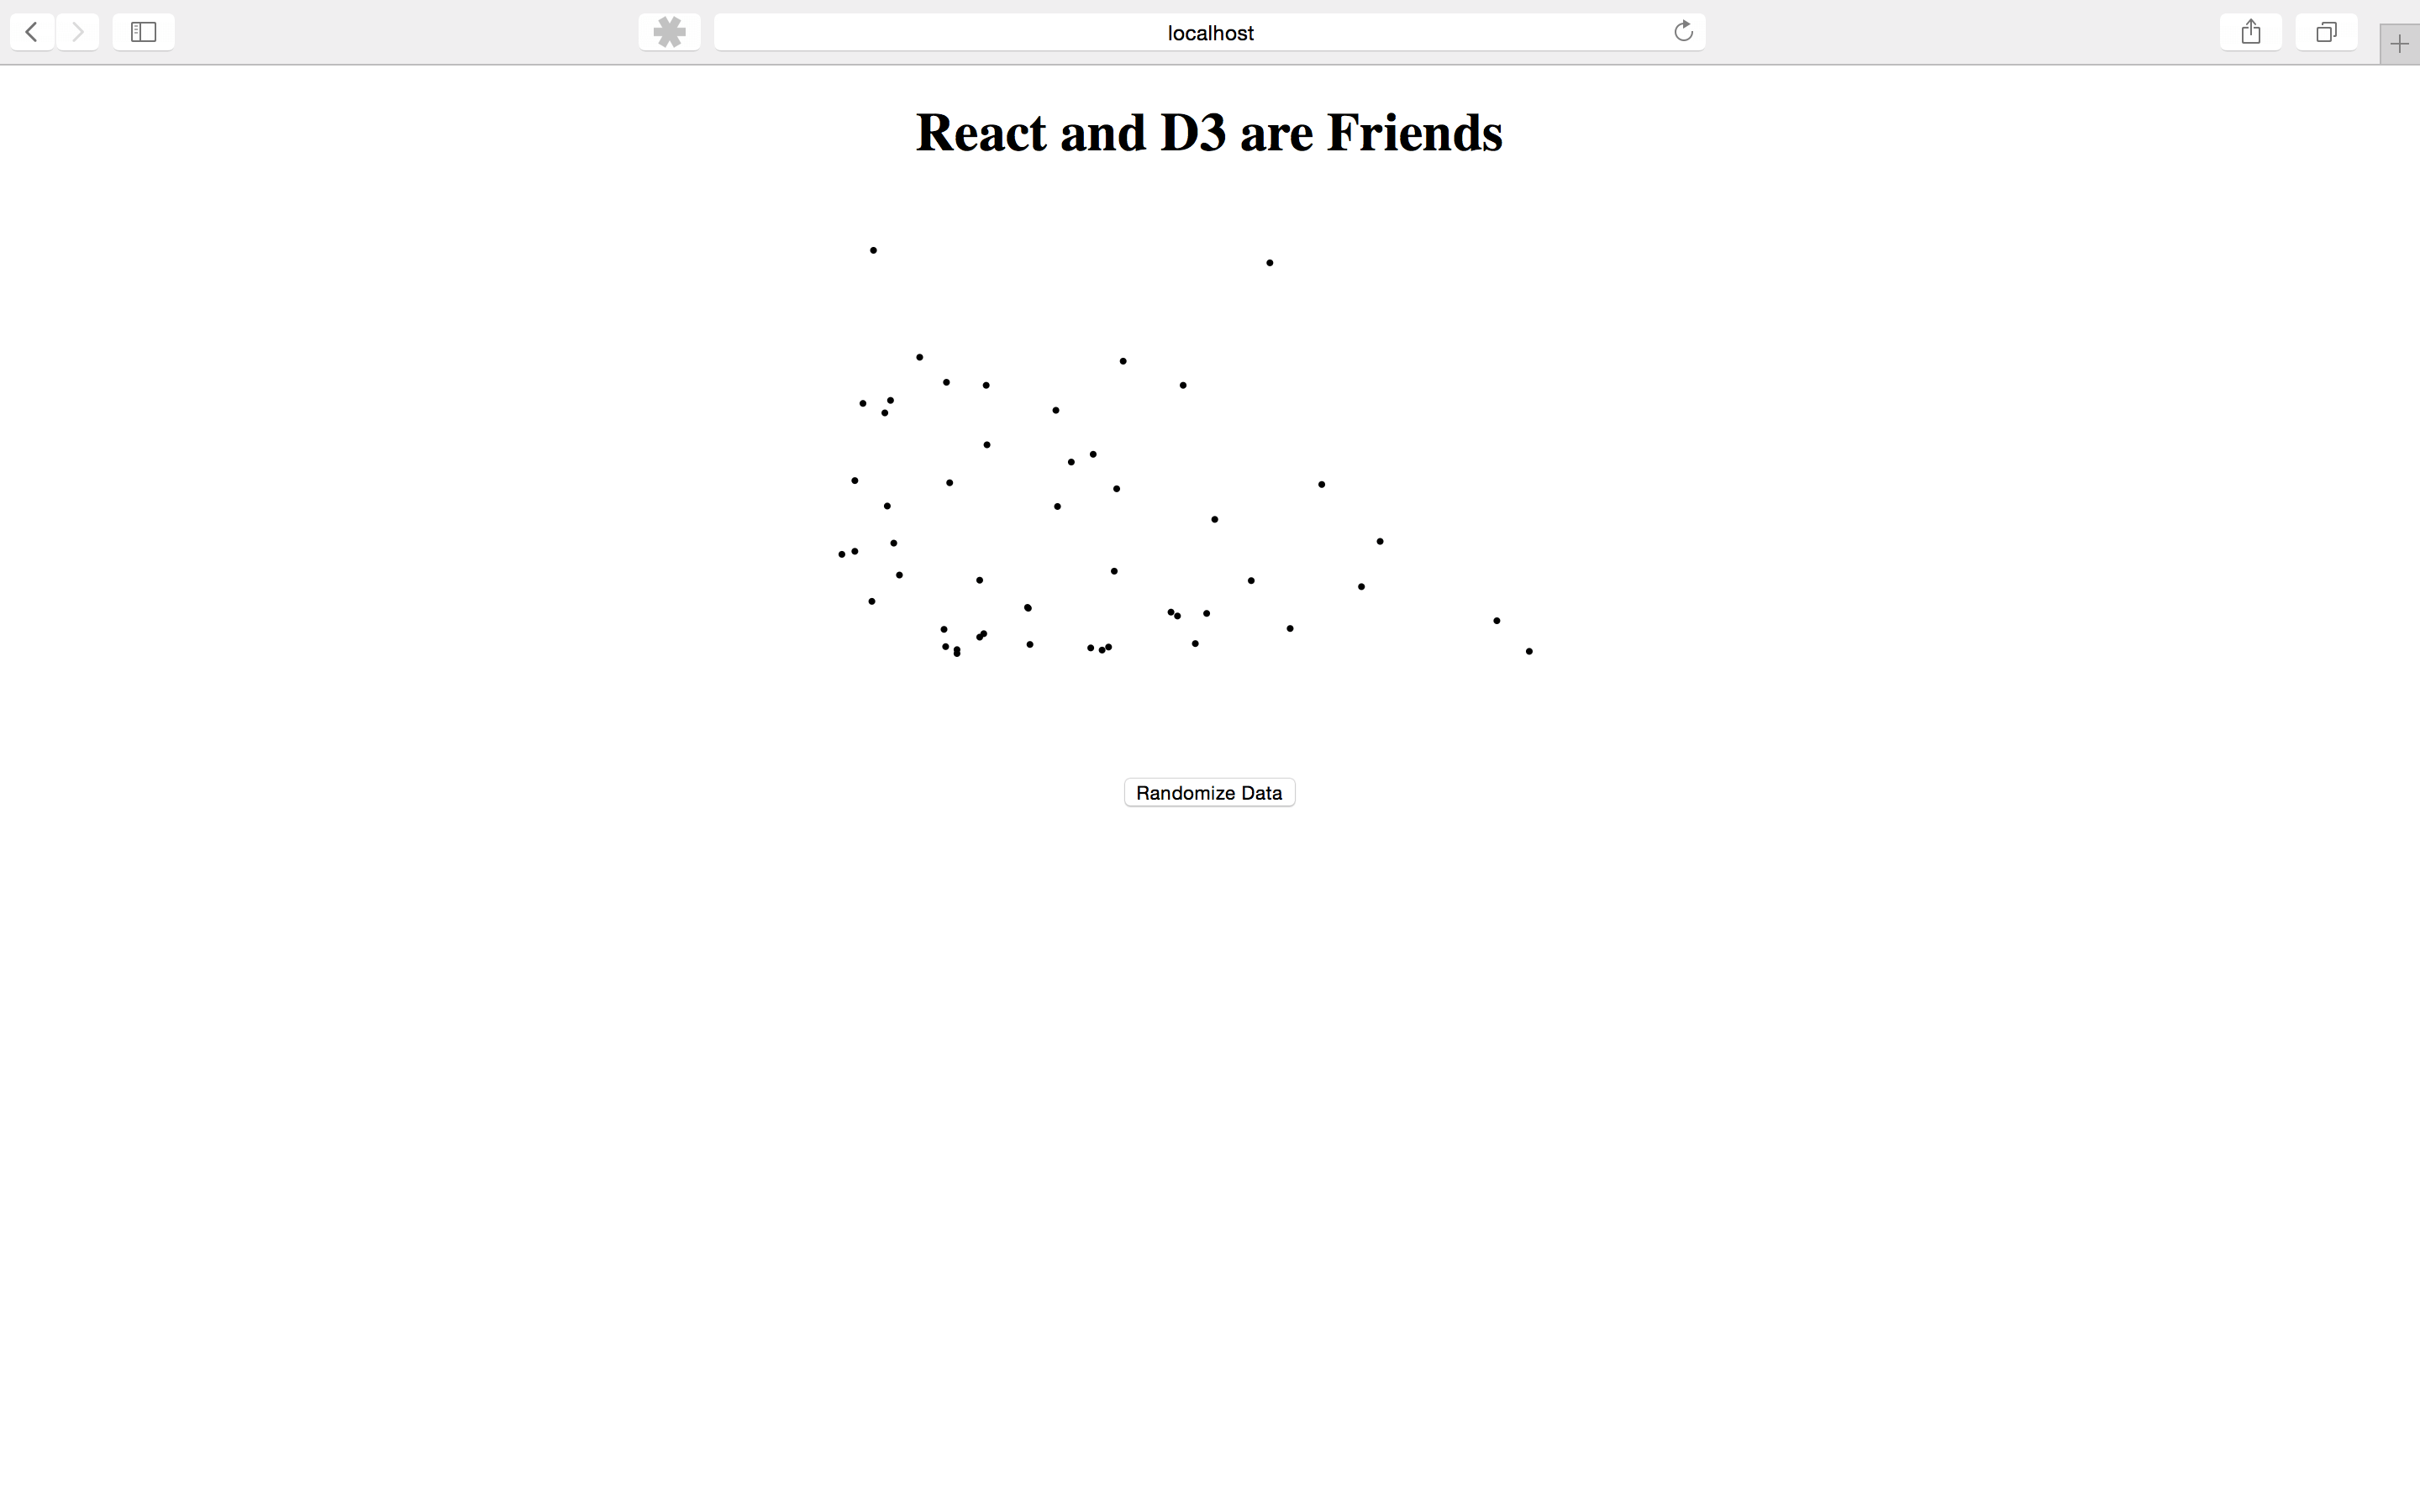
We can see our random data and randomize that data via user input. Awesome! But we’re missing a way to read this data. What we need are axes. Let’s create them now.
Let’s open up ScatterPlot.jsx and add an XYAxis component
// unfinished/src/components/scatter-plot.jsx

// ...

import XYAxis       from './x-y-axis';

// ...

export default (props) => {
  const scales = { xScale: xScale(props), yScale: yScale(props) };
  return <svg width={props.width} height={props.height}>
    <DataCircles {...props} {...scales} />
    <XYAxis {...props} {...scales} />
  </svg>
}
Now, let’s create the XYAxis component;
// unfinished/src/components/x-y-axis.jsx
import React  from 'react';
import Axis   from './axis';

export default (props) => {
  const xSettings = {
    translate: `translate(0, ${props.height - props.padding})`,
    scale: props.xScale,
    orient: 'bottom'
  };
  const ySettings = {
    translate: `translate(${props.padding}, 0)`,
    scale: props.yScale,
    orient: 'left'
  };
  return <g className="xy-axis">
    <Axis {...xSettings}/>
    <Axis {...ySettings}/>
  </g>
}
For simplicity’s sake, we’re creating two objects which will hold the props for each of our X-Y axes. Let’s create an axis component to explain what these props do. Go ahead and create axis.jsx
// unfinished/src/components/x-y-axis.jsx
import React from 'react';
import d3    from 'd3';

export default class Axis extends React.Component {
  componentDidMount() {
    this.renderAxis();
  }

  componentDidUpdate() {
    this.renderAxis();
  }

  renderAxis() {
    var node  = this.refs.axis;
    var axis = d3.svg.axis().orient(this.props.orient).ticks(5).scale(this.props.scale);
    d3.select(node).call(axis);
  }

  render() {
    return <g className="axis" ref="axis" transform={this.props.translate}></g>
  }
}
Our strategy up to this point has been to let React exclusively handle the DOM. This is a good general rule, but we should leave room for nuance. In this case, the math and work necessary in order to render an axis is quite complicated and D3 has abstracted that pretty nicely. We’re going to let D3 have access to the DOM in this case. And since we’re only going to render a maximum of 2 axis, the trade-off in terms of performance is negligible.
We’re going to create a g element to hand over to D3 and its DOM manipulation. transform is an attribute of a g that defines a list of transform definitions applied to an element and an element’s children. We’re passing in a translate attribute that moves the g element to where we want it. SVG is similar to canvas in that x coordinates start at the top rather than at the bottom, so we have to account for this. Otherwise, our X-Axis would be right at the top of the chart. For the Y-Axis, we want to leave some room for rendering the tickmark values.
componentDidMount() is a special React lifecycle method that is called immediately after the React component is mounted on the DOM. It is only called on the initial render. When this component is now rendered on the DOM, we’re going to pass a real DOM node to D3 so it can work its magic. By adding a “ref” attribute to the g element, we can refer to it later via this.refs. Every time this component is re-rendered, we want D3 to re-draw the axis. That’s where componentDidUpdate() comes in. It’s called every time a component is re-rendered. You can learn more about lifecycle methods here.
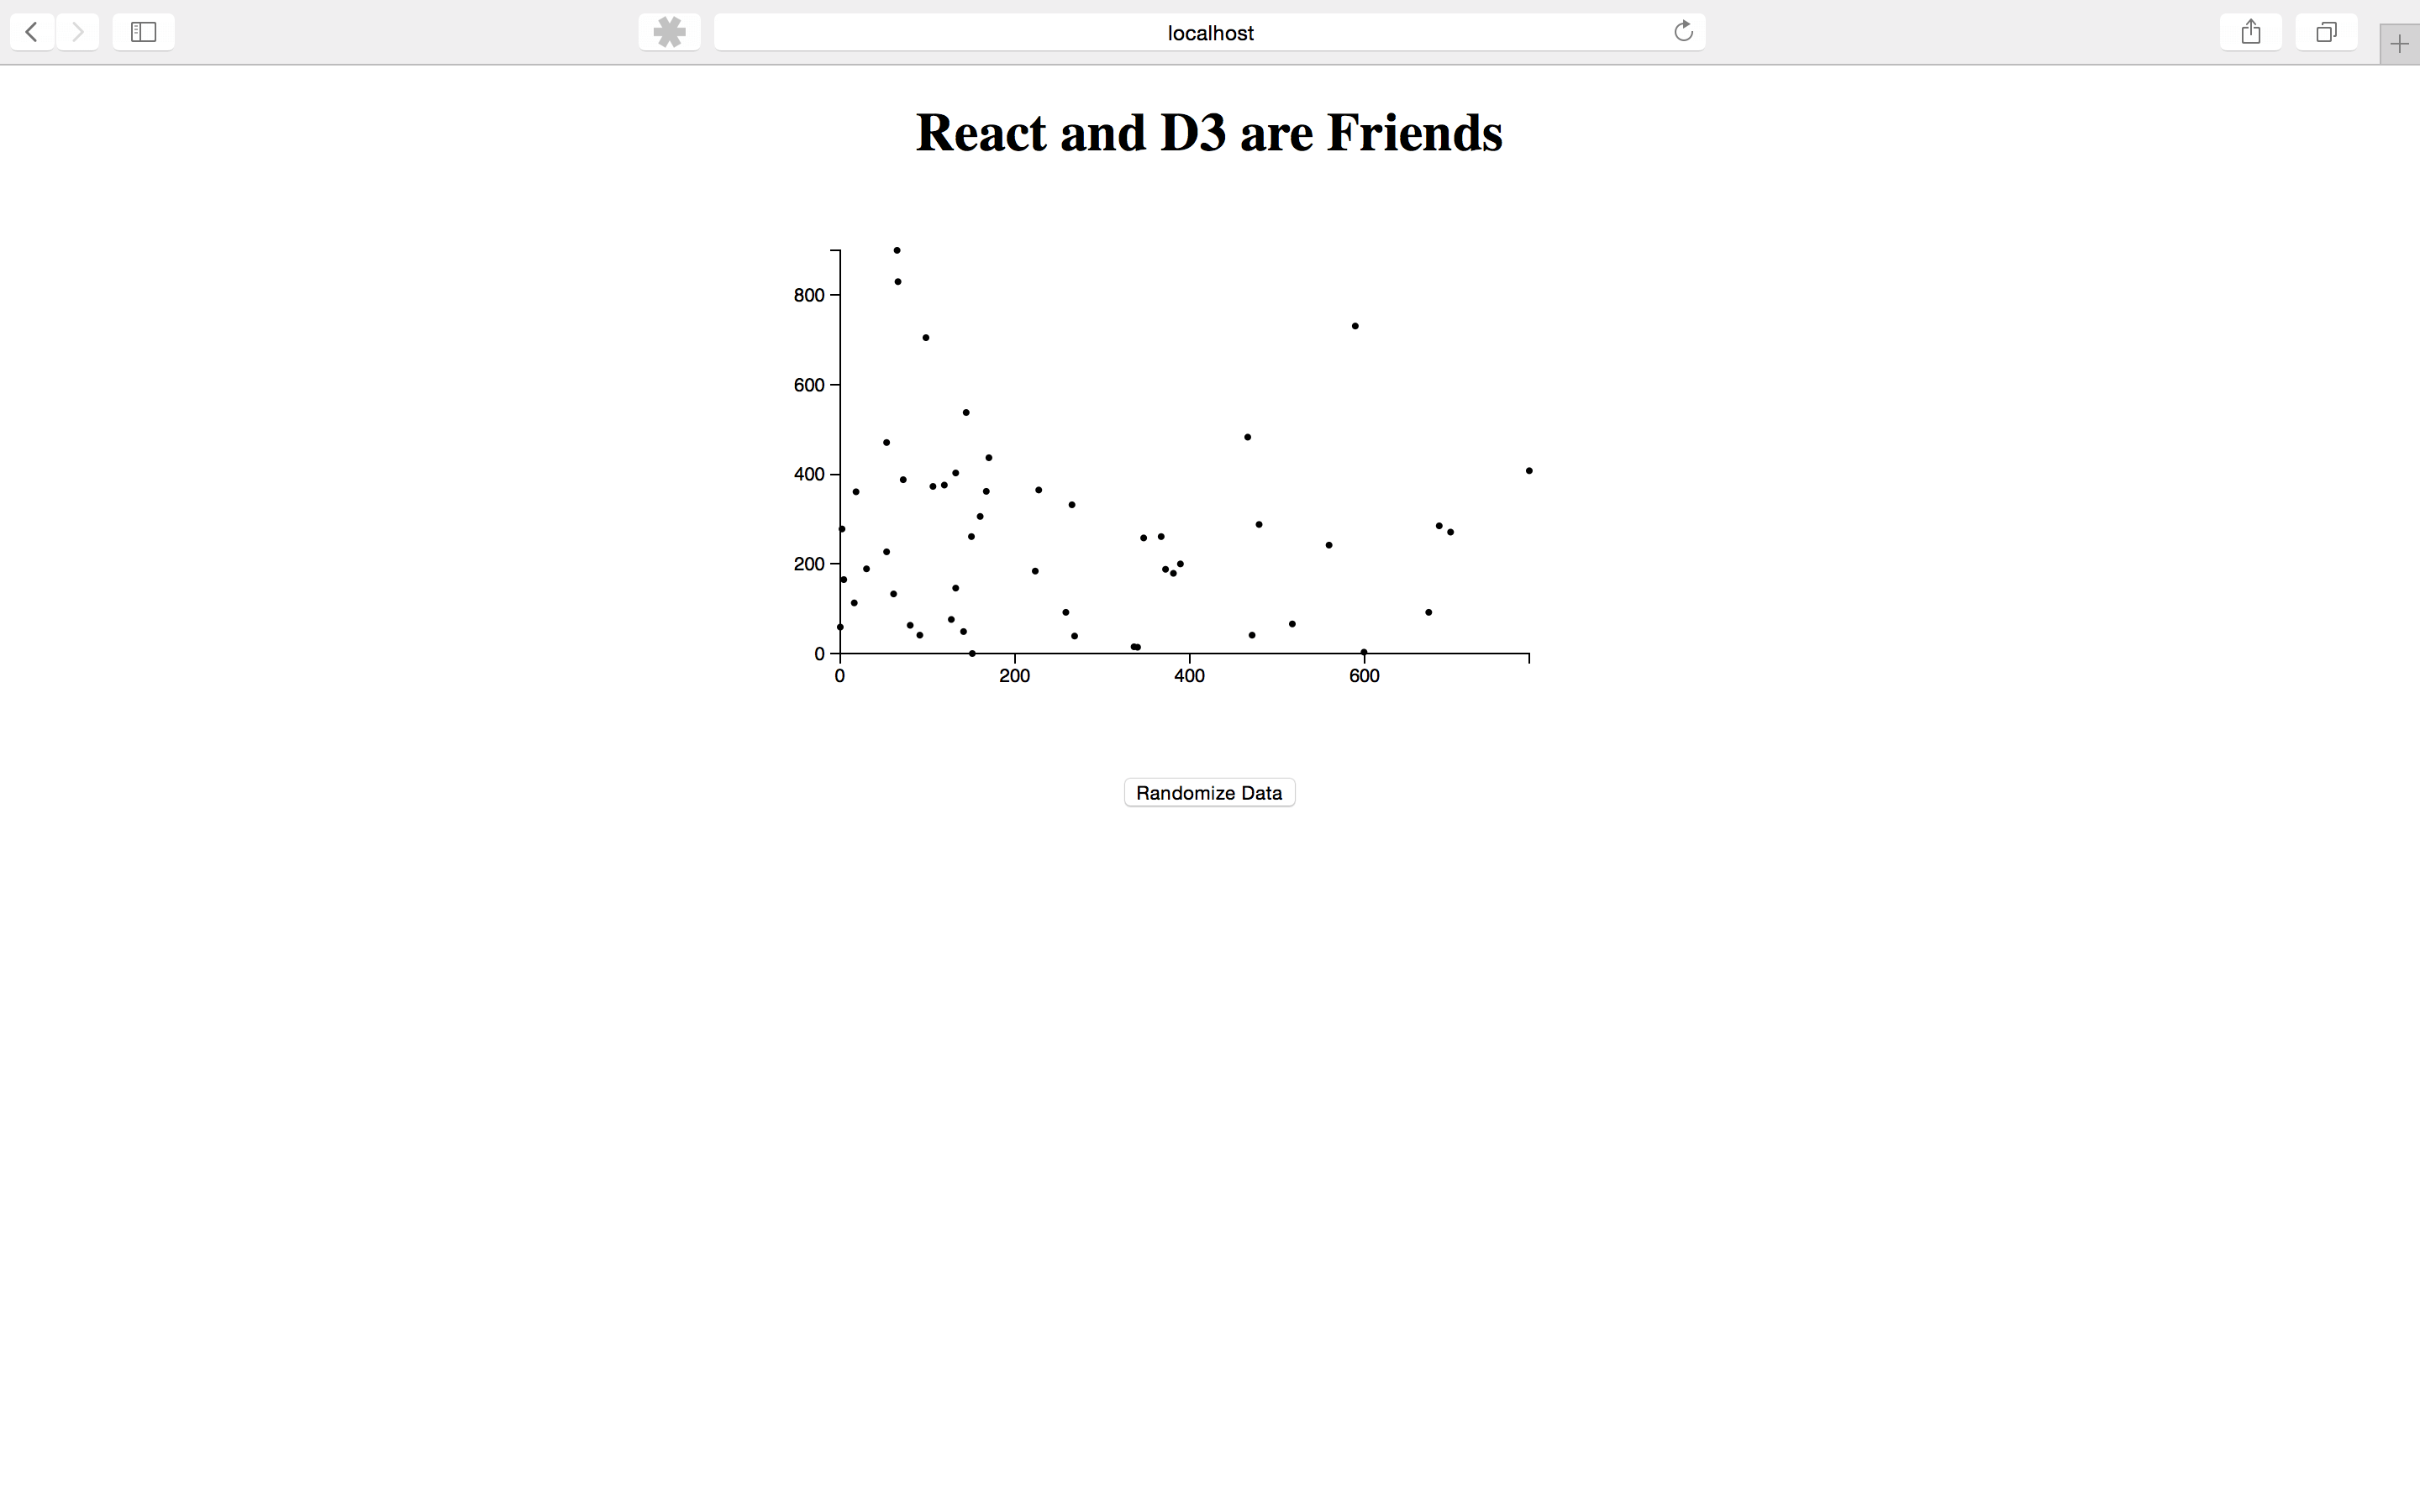
Now, if we take a look at the browser again, we can see the axis, and when we randomize the data, they update automatically to reflect the changes.
Conclusion
This is but a short introduction to React and D3. If you want to learn more check out our upcoming workshop, React and D3, a crash course in learning how to create data visualizations with these two in demand libraries. Reserve your spot now on Eventbrite and get 20% off admission. Learn more at the Eventbrite page